| Echarts折线图获取数据库数据展示 | 您所在的位置:网站首页 › echarts 折线图数据值 › Echarts折线图获取数据库数据展示 |
Echarts折线图获取数据库数据展示
|
Echarts折线图获取mysql中的数据展示
需求:1 设计思路:2 数据表设计3 需求分析4 后端接口开发5 前端数据展示
需求:
将数据库活动表的4种信息状态以 echarts表格 展示出来(活动总数、已审核活动数、待审核活动数、未审核活动数) 1 设计思路:①统计数据库中要展示的数据量,例如时间- -数量 1)直接通过数据库语句查询出展示的数据。优点:在数据量不大的时候,容易实现需求,保证了数据的及时性和准确性;缺点:数据量大,每次查看页面都需要从数据库中先统计数量,在查出并显示数据 2)通过定时任务,将需要展示的数据查询出来并保存在另一张新表中,在每天固定时间查询数据并保存在数据库中。优点:不需要频繁操作数据库,性能得到优化;缺点:实现起来比较复杂,无法及时获取数据库中准确的信息。 ②后端使用定时器(或者加上canal同步数据) ③前端使用vue+echarts显示数据 2 数据表设计建立活动数据统计表(将活动表中数量按照日期时间进行统计,并以 统计日期----数据 格式保存到统计表中)
echarts官网实例
①前端需要接收两部分数据:日期 和 日期对应数量 ②前端要求传入的为 json数组 结构,对应后端java代码是 list集合 ③后端创建两个list集合,一个 日期list,一个 数量list Controller层 @RestController @RequestMapping("/count-activity") @CrossOrigin @Api(tags = "数据统计") public class CountActNumController { @Autowired private ActivityAdminService activitiesAdminService; @Autowired private StatisticsDailyService statisticsDailyService; @ApiOperation(value= "根据日期统计当前日期的各项信息,生成统计数据") @GetMapping(value = "data/{day}") public R Activities(@PathVariable("day") String day){ activitiesAdminService.createActStatisticsByDay(day); return R.ok(); } @ApiOperation(value = "活动图表显示,返回两部分数据,日期json数组,数量json数组") @GetMapping("showData/{begin}/{end}") public R showData(@PathVariable String begin, @PathVariable String end) { Map map = statisticsDailyService.getActShowData(begin,end); return R.ok().data(map); } }Service层 @Service public class StatisticsDailyServiceImpl implements StatisticsDailyService { @Autowired private StatisticsDailyMapper statisticsDailyMapper; @Override public Map getActShowData(String begin, String end) { //根据条件查询活动统计表中对应数据 List staList = statisticsDailyMapper.selectActList(begin,end); //因为返回有两部分数据:日期 和 日期对应数量 //前端要求数组json结构,对应后端java代码是list集合 //创建两个list集合,一个日期list,一个数量list List dateInformationList = new ArrayList(); List typeNumList = new ArrayList(); //创建需要展示类型的对象,对应4种活动类型统计 StatisticsDailyVO countAllActNumDailyVO = new StatisticsDailyVO(); StatisticsDailyVO countCheckedActNumDailyVO = new StatisticsDailyVO(); StatisticsDailyVO countCheckingActNumVO = new StatisticsDailyVO(); StatisticsDailyVO countUncheckedActNumVO = new StatisticsDailyVO(); //创建4个list集合,分别存储4种活动的统计数量 List countAllActNum = new ArrayList(); List countCheckedActNum = new ArrayList(); List countCheckingActNum = new ArrayList(); List countUncheckedActNum = new ArrayList(); //遍历查询所有数据list集合,进行封装 for (int i = 0; i /** * 网站统计信息 * @param begin * @param end * @return */ List selectActList(@Param("begin") String begin, @Param("end") String end); }Pojo类 @Data @ApiModel(value="活动表统计信息", description="网站统计日数据") public class StatisticsActDaily implements Serializable { private static final long serialVersionUID = 1L; @ApiModelProperty(value = "主键") private Integer id; @ApiModelProperty(value = "统计日期") private String dateCalculated; @ApiModelProperty(value = "活动总数") private Integer allActNum; @ApiModelProperty(value = "已审核数") private Integer checkedActNum; @ApiModelProperty(value = "正在审核数") private Integer checkingActNum; @ApiModelProperty(value = "未审核数") private Integer uncheckedActNum; @ApiModelProperty(value = "创建时间") private Date gmtCreate; @ApiModelProperty(value = "更新时间") private Date gmtModified; } @Data @ApiModel(value="统计VO", description="统计VO") public class StatisticsDailyVO implements Serializable { private static final long serialVersionUID = 1L; @ApiModelProperty(value = "统计名称") private String countName; @ApiModelProperty(value = "数量") private List number; }Enum类 @Getter @ToString public enum CountNameEnum { ALL_NUM_COUNT("当日发布总数"), CHECKED_NUM_COUNT("已审核数"), CHECKING_NUM_COUNT("待审核数"), UNCHECK_NUM_COUNT("未审核数") ; private String typeName; private CountNameEnum(String typeName){ this.typeName = typeName; } }测试接口得到返回数据 前端vue部分代码: methods: { showChart() { if(this.searchObj.begin == undefined & this.searchObj.end == undefined){ this.$message.error("每一项不能为空"); }else{ actCharts.getActCharts(this.searchObj).then(res => { this.yData = res.data.series this.xData = res.data.xAxis //调用下面生成图表的方法,改变值 this.setChart() }) } }, xAxis: { data: this.xData, }, // 系列列表。每个系列通过 type 决定自己的图表类型 series: [ { // 系列中的数据内容数组 data: this.yData[1].number, name: this.yData[1].countName, // 折线图 type: 'bar' }, { // 系列中的数据内容数组 data: this.yData[2].number, name: this.yData[2].countName, // 折线图 type: 'bar', }, { // 系列中的数据内容数组 data: this.yData[3].number, name: this.yData[3].countName, // 折线图 type: 'bar', }, { // 系列中的数据内容数组 data: this.yData[0].number, name: this.yData[0].countName, // 折线图 type: 'line', } ] }最终效果: |
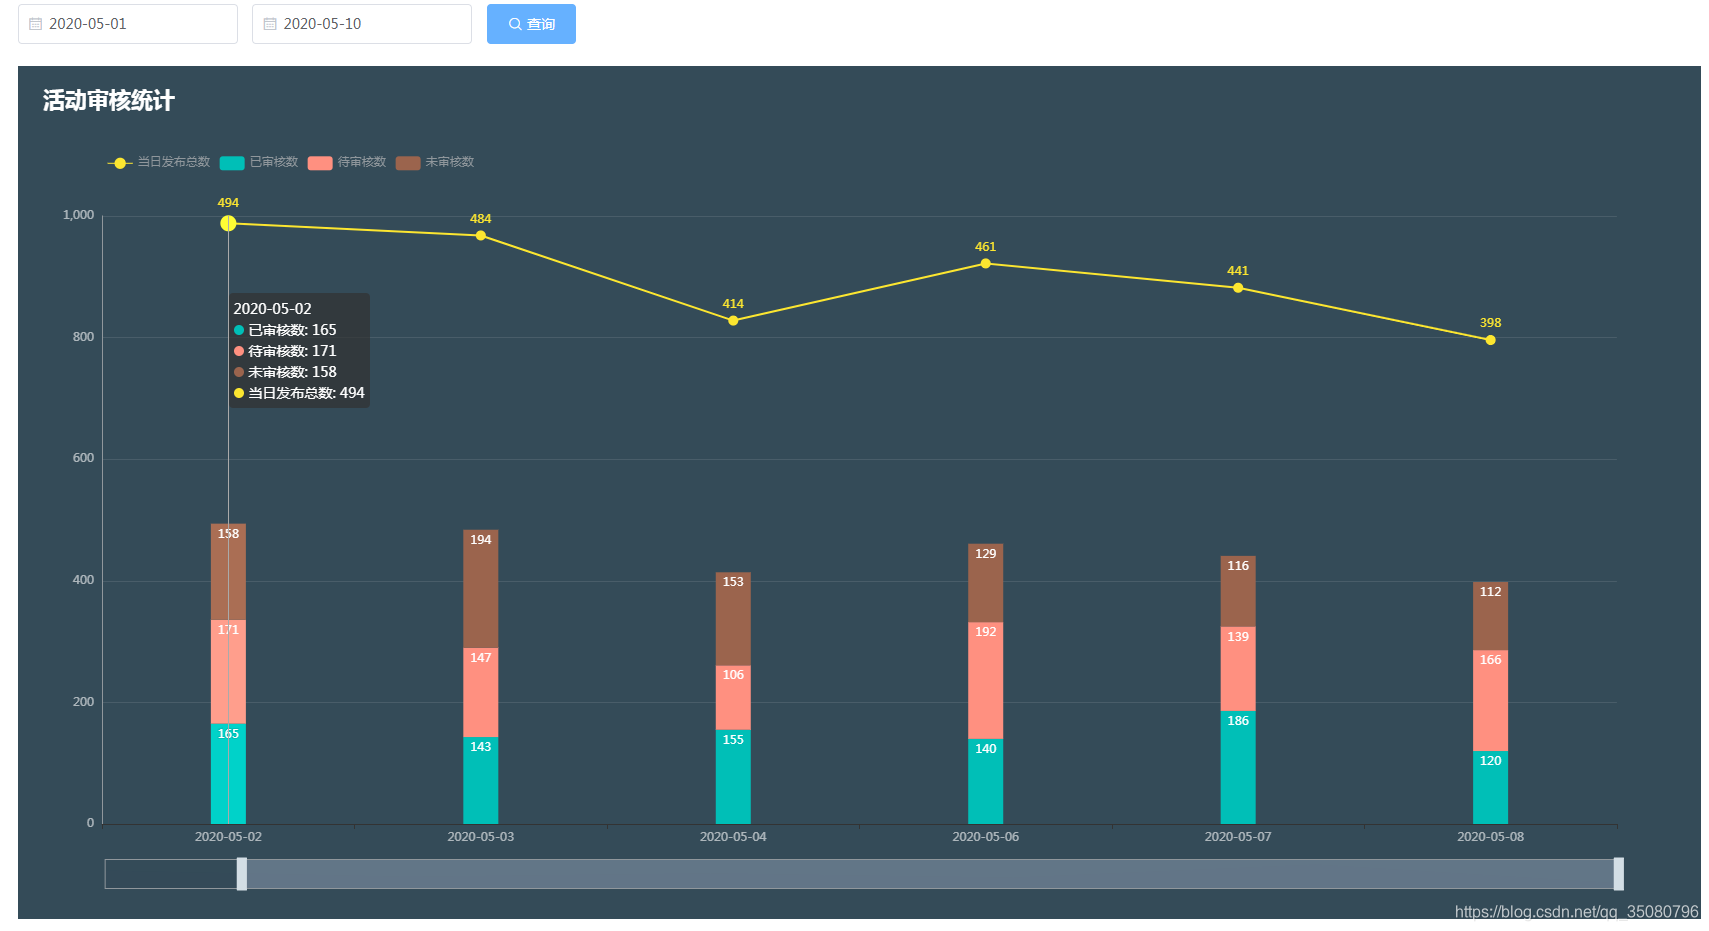
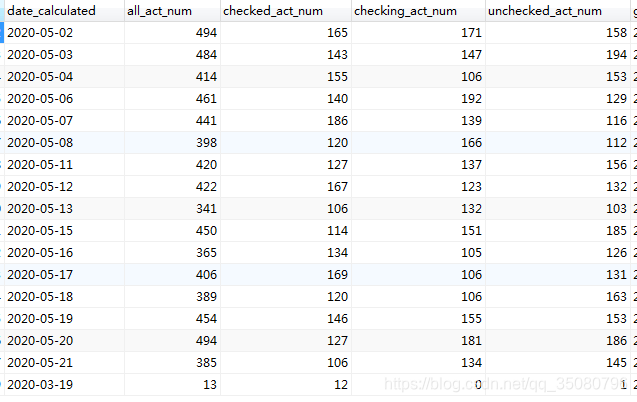 活动统计表如上图所示
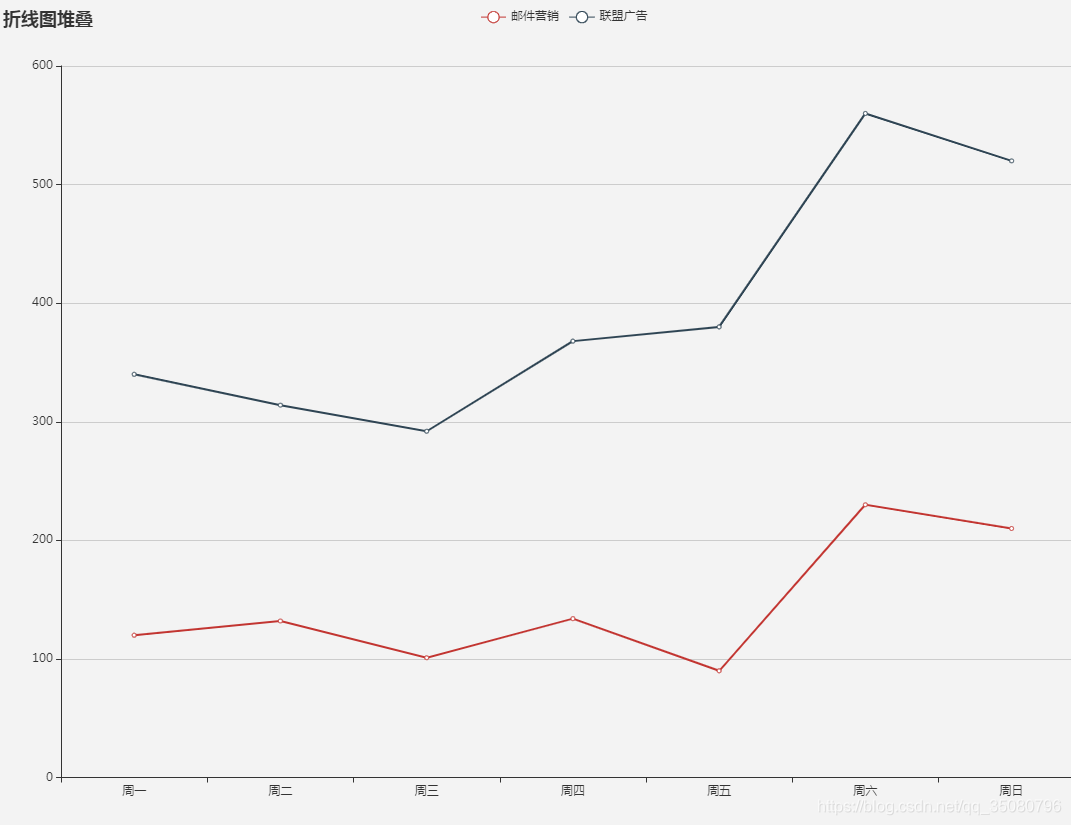 活动统计最终设计效果如上图echarts图表展示
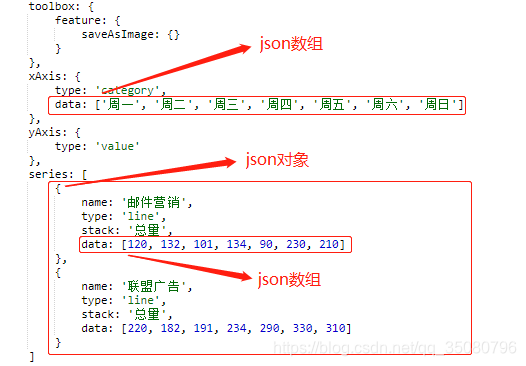 前端接收的数据格式如上图:xAxis里日期数据为json数组;series里数据格式为两个json对象,对象包括名称和data数据,data数据也为json数组
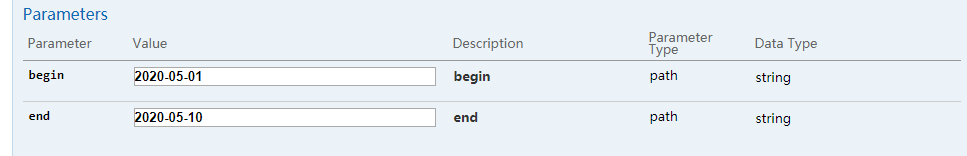
【本文地址】
公司简介
联系我们